India Fiberglass Market By Glass Type (E-Glass, ECR-Glass, H-Glass, AR-Glass, S-Glass), By Product Type (Glass Wool, Direct & Assembled Roving, Yarn, Chopped Strand), By Application (Composites, Insulation), By Region Competition Forecast and Opportunities 2024-2032
Published Date: November - 2024 | Publisher: MIR | No of Pages: 320 | Industry: Infrastructure | Format: Report available in PDF / Excel Format
View Details Buy Now 2890 Download Sample Ask for Discount Request CustomizationIndia Fiberglass Market By Glass Type (E-Glass, ECR-Glass, H-Glass, AR-Glass, S-Glass), By Product Type (Glass Wool, Direct & Assembled Roving, Yarn, Chopped Strand), By Application (Composites, Insulation), By Region Competition Forecast and Opportunities 2024-2032
Forecast Period | 2025-2029 |
Market Size (2023) | USD 1.5 Billion |
Market Size (2029) | USD 2.38 Billion |
CAGR (2024-2029) | 8% |
Fastest Growing Segment | Insulation |
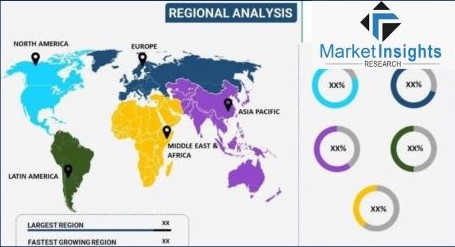
Largest Market | West India |
Download Sample Ask for Discount Request Customization
India Fiber Glass Market has valued at USD 1.5 Billion in 2023 and is anticipated to project robust growth in the forecast period with a CAGR of 8% through 2029. India Fiber Glass Market
A popular type of fiber-reinforced plastic that uses glass fiber is fiber glass. The fibers can be woven into glass fabric, flattened into a sheet known as a chopped strand mat, or randomly distributed. The plastic matrix can be either a thermoplastic or a thermoset polymer matrix, which is typically based on thermosetting polymers such as epoxy, polyester resin, or vinyl ester resin.
Rising Number of Commercial & Residential Buildings
Increasing Demand for Fiber Glass Panels in Automotive and Transportation Sectors to Drive Market Potential
Download Free Sample ReportInfrastructural Development
- Theexpansion of the India Fiber Glass Market is anticipated to be primarily drivenby urbanization and general infrastructural development. The wide range ofinfrastructure initiatives in the hotel, education, and healthcare sectors, aswell as the development of reasonably priced mass housing, will guarantee theexpansion of the clear glass market nationwide. In the following years, theIndia Clear Glass Market is anticipated to receive a significant boost from anumber of recent government initiatives, including the Smart Cities Mission. Inaddition, India's expanding urbanization will increase the demand for clearglass throughout the nation.
Growth in Automotive Industry
Market Segmentation
Market Players
Attribute |
Details |
Base Year |
2023 |
Historic Data |
2024-2032 – 2022 |
Estimated Year |
2024 |
Forecast Period |
2025 – 2029 |
Quantitative Units |
Revenue in USD Million and CAGR for 2024-2032-2023 and 2024-2029 |
Report coverage |
Revenue forecast, company share, growth factors, and trends |
Segments covered |
Glass Type Product Type Application Region |
Regional scope |
West India, South India, North India, East India |
Key companies profiled |
Bansal Fiber Glass, Cosmos Fibre Glass Ltd, U.P. Twiga Fiber Glass Ltd., Fibre Mould (India), Rohit Fibre Glass Industries, Srm (India) Ltd, SHREE GANESH FIBERGLASS CO., Nav Jeevan Fiber Glass Pvt Ltd., Jain Fibre Glass Industries, Fiberglass world (Sunny Verma Fiberglass works) |
Customization scope |
10% free report customization with purchase. Addition or alteration to country, regional & segment scope. |
Pricing and purchase options |
Avail customized purchase options to meet your exact research needs. Explore purchase options |
Delivery Format |
PDF and Excel through Email (We can also provide the editable version of the report in PPT/Word format on special request) |
Report Scope
India Fiber Glass Market
o
o
o
o
o
India Fiber Glass Market
o
o
o
o
Download Sample Ask for Discount Request Customization
India Fiber Glass Market
o
o
India Fiber Glass Market
o
o
o
o
Competitive Landscape
Company Profiles
Download Sample Ask for Discount Request Customization
found at Customizations
With the given market data, Market insights research offers customizations according to a company's specific needs. The following customization options are found at for the report
Company Information
- Detailed analysis and profiling of additional market players (up to five).
India Fiber Glass Market is an upcoming report to be released soon. If you wish an early delivery of this report or want to confirm the date of release, please contact us at sales@techsciresearch.com
Table of Content
Table of Contents
Chapter 1. Methodology and Scope
1.1. Market Segmentation & Scope
1.2. Segment Definitions
1.2.1. Product Type
1.2.2. Application
1.2.3. End Use
1.3. Estimates and Forecast Timeline
1.4. Research Methodology
1.5. Information Procurement
1.5.1. Purchased Database
1.5.2. GVR’s Internal Database
1.5.3. Secondary Sources
1.5.4. Primary Research
1.6. Information Analysis
1.6.1. Data Analysis Models
1.7. Market Formulation & Data Visualization
1.8. Model Details
1.8.1. Commodity Flow Analysis
1.9. List of Secondary Sources
1.10. Objectives
Chapter 2. Executive Summary
2.1. Market Snapshot
2.2. Segment Snapshot
2.3. Competitive Landscape Snapshot
Chapter 3. Fiberglass Market Variables, Trends, & Scope
3.1. Market Lineage Outlook
3.2. Market Dynamics
3.2.1. Market Driver Analysis
3.2.2. Market Restraint Analysis
3.3. Business Environment Analysis
3.3.1. Industry Analysis - Porter’s Five Forces Analysis
3.3.1.1. Supplier Power
3.3.1.2. Buyer Power
3.3.1.3. Substitution Threat
3.3.1.4. Threat of New Entrant
3.3.1.5. Competitive Rivalry
3.3.2. PESTLE Analysis
Chapter 4. Fiberglass Market: Product Type Business Analysis
4.1. Product Type Market Share, 2024 & 2030
4.2. Product Type Segment Dashboard
4.3. Market Size & Forecasts and Trend Analysis, by Product Type, 2018 to 2030 (USD Million) (Kilotons)
4.4. Glass Wool
4.4.1. Glass Wool Market, 2018 - 2030 (USD Million) (Kilotons)
4.5. Yarn
4.5.1. Yarn Market, 2018 - 2030 (USD Million) (Kilotons)
4.6. Roving
4.6.1. Roving Market, 2018 - 2030 (USD Million) (Kilotons)
4.7. Chopped Strand
4.7.1. Chopped Strand Market, 2018 - 2030 (USD Million) (Kilotons)
4.8. Others
4.8.1. Others Market, 2018 - 2030 (USD Million) (Kilotons)
Chapter 5. Fiberglass Market: Application Business Analysis
5.1. Application Market Share, 2024 & 2030
5.2. Application Segment Dashboard
5.3. Market Size & Forecasts and Trend Analysis, by Application, 2018 to 2030 (USD Million) (Kilotons)
5.4. Insulation
5.4.1. Insulation Market, 2018 - 2030 (USD Million) (Kilotons)
5.5. Composites
5.5.1. Composites Market, 2018 - 2030 (USD Million) (Kilotons)
Chapter 6. Fiberglass Market: End use Business Analysis
6.1. End use Market Share, 2024 & 2030
6.2. End use Segment Dashboard
6.3. Market Size & Forecasts and Trend Analysis, by End use, 2018 to 2030 (USD Million) (Kilotons)
6.4. Automobile
6.4.1. Automobile Market, 2018 - 2030 (USD Million) (Kilotons)
6.5. Construction
6.5.1. Construction Market, 2018 - 2030 (USD Million) (Kilotons)
6.6. Aerospace
6.6.1. Aerospace Market, 2018 - 2030 (USD Million) (Kilotons)
6.7. Wind Energy
6.7.1. Wind Energy Market, 2018 - 2030 (USD Million) (Kilotons)
6.8. Others
6.8.1. Others Market, 2018 - 2030 (USD Million) (Kilotons)
Chapter 7. Fiberglass Market: Regional Estimates & Trend Analysis
7.1. Regional Market Share Analysis, 2024 & 2030
7.2. Regional Market Dashboard
7.3. Market Size, & Forecasts Trend Analysis, 2018 to 2030:
7.4. North America
7.4.1. North America Fiberglass Market Estimates and Forecasts, 2018 - 2030 (USD Million) (Kilotons)
7.4.2. U.S.
7.4.2.1. Key Country Dynamics
7.4.2.2. Regulatory Framework
7.4.2.3. Competitive Insights
7.4.2.4. U.S. Fiberglass Market Estimates and Forecasts, 2018 - 2030 (USD Million) (Kilotons)
7.4.3. Canada
7.4.3.1. Key Country Dynamics
7.4.3.2. Regulatory Framework
7.4.3.3. Competitive Insights
7.4.3.4. Canada Fiberglass Market Estimates and Forecasts, 2018 - 2030 (USD Million) (Kilotons)
7.4.4. Mexico
7.4.4.1. Key Country Dynamics
7.4.4.2. Regulatory Framework
7.4.4.3. Competitive Insights
7.4.4.4. Mexico Fiberglass Market Estimates and Forecasts, 2018 - 2030 (USD Million) (Kilotons)
7.5. Europe
7.5.1. Europe Fiberglass Market Estimates and Forecasts, 2018 - 2030 (USD Million) (Kilotons)
7.5.2. UK
7.5.2.1. Key Country Dynamics
7.5.2.2. Regulatory Framework
7.5.2.3. Competitive Insights
7.5.2.4. UK Fiberglass Market Estimates and Forecasts, 2018 - 2030 (USD Million) (Kilotons)
7.5.3. Germany
7.5.3.1. Key Country Dynamics
7.5.3.2. Regulatory Framework
7.5.3.3. Competitive Insights
7.5.3.4. Germany Fiberglass Market Estimates and Forecasts, 2018 - 2030 (USD Million) (Kilotons)
7.5.4. France
7.5.4.1. Key Country Dynamics
7.5.4.2. Regulatory Framework
7.5.4.3. Competitive Insights
7.5.4.4. France Fiberglass Market Estimates and Forecasts, 2018 - 2030 (USD Million) (Kilotons)
7.6. Asia Pacific
7.6.1. Asia Pacific Fiberglass Market Estimates and Forecasts, 2018 - 2030 (USD Million) (Kilotons)
7.6.2. Japan
7.6.2.1. Key Country Dynamics
7.6.2.2. Regulatory Framework
7.6.2.3. Competitive Insights
7.6.2.4. Japan Fiberglass Market Estimates and Forecasts, 2018 - 2030 (USD Million) (Kilotons)
7.6.3. China
7.6.3.1. Key Country Dynamics
7.6.3.2. Regulatory Framework
7.6.3.3. Competitive Insights
7.6.3.4. China Fiberglass Market Estimates and Forecasts, 2018 - 2030 (USD Million) (Kilotons)
7.6.4. India
7.6.4.1. Key Country Dynamics
7.6.4.2. Regulatory Framework
7.6.4.3. Competitive Insights
7.6.4.4. India Fiberglass Market Estimates and Forecasts, 2018 - 2030 (USD Million) (Kilotons)
7.6.5. South Korea
7.6.5.1. Key Country Dynamics
7.6.5.2. Regulatory Framework
7.6.5.3. Competitive Insights
7.6.5.4. South Korea Fiberglass Market Estimates and Forecasts, 2018 - 2030 (USD Million) (Kilotons)
7.7. Latin America
7.7.1. Latin America Fiberglass Market Estimates and Forecasts, 2018 - 2030 (USD Million) (Kilotons)
7.7.2. Brazil
7.7.2.1. Key Country Dynamics
7.7.2.2. Regulatory Framework
7.7.2.3. Competitive Insights
7.7.2.4. Brazil Fiberglass Market Estimates and Forecasts, 2018 - 2030 (USD Million) (Kilotons)
7.7.3. Argentina
7.7.3.1. Key Country Dynamics
7.7.3.2. Regulatory Framework
7.7.3.3. Competitive Insights
7.7.3.4. Argentina Fiberglass Market Estimates and Forecasts, 2018 - 2030 (USD Million) (Kilotons)
7.8. MEA
7.8.1. MEA Fiberglass Market Estimates and Forecasts, 2018 - 2030 (USD Million) (Kilotons)
7.8.2. South Africa
7.8.2.1. Key Country Dynamics
7.8.2.2. Regulatory Framework
7.8.2.3. Competitive Insights
7.8.2.4. South Africa Fiberglass Market Estimates and Forecasts, 2018 - 2030 (USD Million) (Kilotons)
7.8.3. Saudi Arabia
7.8.3.1. Key Country Dynamics
7.8.3.2. Regulatory Framework
7.8.3.3. Competitive Insights
7.8.3.4. Saudi Arabia Fiberglass Market Estimates and Forecasts, 2018 - 2030 (USD Million) (Kilotons)
Chapter 8. Competitive Landscape
8.1. Participant Overview
8.2. Company Market Position Analysis
8.3. Company Categorization
8.4. Strategy Mapping
8.5. Company Profiles/Listing
8.5.1. Owens Corning
8.5.1.1. Overview
8.5.1.2. Financial Performance
8.5.1.3. Product Type Benchmarking
8.5.1.4. Strategic Initiatives
8.5.2. Saint-Gobain
8.5.2.1. Overview
8.5.2.2. Financial Performance
8.5.2.3. Product Type Benchmarking
8.5.2.4. Strategic Initiatives
8.5.3. Nippon Electric Glass
8.5.3.1. Overview
8.5.3.2. Financial Performance
8.5.3.3. Product Type Benchmarking
8.5.3.4. Strategic Initiatives
8.5.4. Jushi Group Co. Ltd.
8.5.4.1. Overview
8.5.4.2. Financial Performance
8.5.4.3. Product Type Benchmarking
8.5.4.4. Strategic Initiatives
8.5.5. 3B-The Fiberglass Company
8.5.5.1. Overview
8.5.5.2. Financial Performance
8.5.5.3. Product Type Benchmarking
8.5.5.4. Strategic Initiatives
8.5.6. PPG Industries
8.5.6.1. Overview
8.5.6.2. Financial Performance
8.5.6.3. Product Type Benchmarking
8.5.6.4. Strategic Initiatives
8.5.7. Johns Manville
8.5.7.1. Overview
8.5.7.2. Financial Performance
8.5.7.3. Product Type Benchmarking
8.5.7.4. Strategic Initiatives
8.5.8. Taishan Fiberglass, Inc.
8.5.8.1. Overview
8.5.8.2. Financial Performance
8.5.8.3. Product Type Benchmarking
8.5.8.4. Strategic Initiatives
8.5.9. Chongqing Polycomp International Corp.
8.5.9.1. Overview
8.5.9.2. Financial Performance
8.5.9.3. Product Type Benchmarking
8.5.9.4. Strategic Initiatives
8.5.10. Knauf Insulation
8.5.10.1. Overview
8.5.10.2. Financial Performance
8.5.10.3. Product Type Benchmarking
8.5.10.4. Strategic Initiatives
List Tables Figures
To get a detailed Table of content/ Table of Figures/ Methodology Please contact our sales person at ( chris@marketinsightsresearch.com )
FAQ'S
For a single, multi and corporate client license, the report will be available in PDF format. Sample report would be given you in excel format. For more questions please contact:
Within 24 to 48 hrs.
You can contact Sales team (sales@marketinsightsresearch.com) and they will direct you on email
You can order a report by selecting payment methods, which is bank wire or online payment through any Debit/Credit card, Razor pay or PayPal.
Discounts are available.
Hard Copy