Hazardous Area Equipment Market – Global Industry Size, Share, Trends, Opportunity, and Forecast Segmented by Equipment (Power Supply Systems, Electric Motors, Surveillance Systems, Cable Glands and Connectors, Automation and Control Products, Enclosures, Lighting Products, Push Buttons and Signaling Devices), by End User Industry (Oil and Gas, Energy and Power Generation, Chemical, Food and Bever
Published Date: November - 2024 | Publisher: MIR | No of Pages: 320 | Industry: Infrastructure | Format: Report available in PDF / Excel Format
View Details Buy Now 2890 Download Sample Ask for Discount Request Customization| Forecast Period | 2025-2029 |
| Market Size (2023) | USD 10.95 Billion |
| Market Size (2029) | USD 16.61 Billion |
| CAGR (2024-2029) | 7.03% |
| Fastest Growing Segment | Power Supply Systems |
| Largest Market | Asia Pacific |

Ask for Discount Request Customization
Market Overview
Global Hazardous Area Equipment Market was valued at USD 10.95 Billion in 2023 and is anticipated to project robust growth in the forecast period with a CAGR of 7.03% through 2029.
Key Market Drivers
Industrial Growth
Industrial growth plays a pivotal role in driving the global hazardous area equipment market, as it caters to industries where potentially explosive atmospheres or hazardous materials are present. This growth is characterized by expanding sectors such as oil and gas, chemicals, pharmaceuticals, mining, manufacturing, and more. Here's how industrial growth is a significant driver for the hazardous area equipment marketIncreased Infrastructure DevelopmentAs industries expand, they require additional infrastructure and facilities, many of which are located in or near hazardous areas. This includes new refineries, chemical processing plants, and manufacturing facilities. With such expansion comes a heightened need for hazardous area equipment to ensure safety and compliance with regulations in these potentially explosive environments.
Energy Exploration and ProductionThe oil and gas industry is a primary driver of industrial growth. Exploration and production activities often occur in harsh and hazardous environments, such as offshore drilling platforms or gas extraction sites. Hazardous area equipment is essential for maintaining safety in these operations and preventing catastrophic incidents. Chemical Manufacturing and ProcessingThe chemical industry is another sector that experiences substantial growth. Hazardous chemicals and materials are commonplace in this industry, making safety equipment, including explosion-proof electrical components and safety systems, critical to protect both personnel and assets.
Pharmaceutical and Biotechnology ExpansionThe pharmaceutical and biotechnology sectors are expanding globally. These industries often work with hazardous materials in laboratories and manufacturing facilities, necessitating specialized hazardous area equipment to ensure the safety of personnel and compliance with regulations.
Mining and ExtractionMining operations extract valuable resources from potentially dangerous and unstable environments. The use of hazardous area equipment is essential to manage the risks associated with dust, gas, and other hazardous elements in mining facilities. Manufacturing and Heavy IndustryManufacturing industries are hubs of industrial growth. Hazardous area equipment is used in various heavy industrial processes, including automotive, metalworking, and electronics manufacturing, where explosive or flammable materials may be present.
Expansion of Infrastructure ProjectsLarge-scale infrastructure projects, such as power plants, ports, and transportation hubs, are integral to industrial growth. These projects often involve the construction of facilities in hazardous areas, where safety equipment is vital to protect personnel and critical infrastructure. Technological AdvancementsAs industries grow, they invest in the latest technological advancements. This includes the adoption of cutting-edge hazardous area equipment, which often features improved safety measures, efficiency, and monitoring capabilities.
Globalization of OperationsMany companies expand their operations globally, encountering varying safety standards and regulations in different regions. This drives the need for standardized hazardous area equipment that can be deployed consistently across various locations. In conclusion, industrial growth is a fundamental driver for the global hazardous area equipment market. As industries continue to expand and evolve, the demand for safety measures in potentially explosive or hazardous environments becomes increasingly critical. This demand ensures that hazardous area equipment remains a vital component in safeguarding both personnel and assets in these high-risk settings.
Automation and Industry 4.0
Automation and Industry 4.0, often referred to as the fourth industrial revolution, are key drivers that significantly influence the global hazardous area equipment market. These transformative technologies are reshaping industries across the board, and their impact on hazardous area equipment is profound. Industry 4.0 encompasses the integration of digital technologies, data analytics, the Internet of Things (IoT), artificial intelligence, and automation into industrial processes. As it becomes more widespread, Industry 4.0 is having a profound effect on how hazardous environments are managed and protected. Here's how automation and Industry 4.0 are driving the global hazardous area equipment market
Enhanced Safety and EfficiencyAutomation allows for real-time monitoring of hazardous processes and environments. Advanced sensors and IoT-enabled devices can continuously collect data and send it to control systems, enabling immediate response to any anomalies or safety breaches. This enhanced safety is of paramount importance in hazardous areas, making the demand for intelligent hazardous area equipment soar.
Predictive MaintenanceIndustry 4.0 enables predictive maintenance through data analytics. Equipment in hazardous areas can be monitored for signs of wear or potential failures. This proactive approach not only prevents costly breakdowns but also ensures the continuous safety of the environment. Remote Operation and MonitoringAutomation and connectivity enable remote operation and monitoring of processes in hazardous areas. This reduces the need for human presence in potentially dangerous zones, minimizing risk and ensuring the safety of workers.
Efficient Resource UtilizationIndustry 4.0 technologies optimize the use of resources, including energy and raw materials. This is critical in hazardous environments, where any inefficiency or waste can lead to safety issues or environmental damage. Interconnected SystemsIn an Industry 4.0 setting, various systems within a facility or operation are interconnected, allowing for comprehensive control and coordination. Hazardous area equipment is an integral part of this interconnected network, ensuring that safety is maintained throughout the operation. Customization and ScalabilityIndustry 4.0 allows for the customization and scalability of hazardous area equipment. Solutions can be tailored to specific industry needs and easily adapted to changing requirements as industries evolve.
Data-Driven Decision-MakingWith the wealth of data generated by Industry 4.0 technologies, decision-makers can gain valuable insights into the performance and safety of their hazardous processes. This data-driven approach helps in continuous improvement and risk mitigation. In summary, automation and Industry 4.0 are driving the global hazardous area equipment market by revolutionizing safety and efficiency in hazardous environments. The integration of advanced technologies not only enhances safety measures but also improves the overall productivity and sustainability of industries operating in potentially explosive or hazardous areas. As the world moves toward greater automation and digitalization, the demand for sophisticated and interconnected hazardous area equipment will continue to grow, making it an indispensable component of modern industrial safety.

Ask for Discount Request Customization
Key Market Challenges
Complex Regulatory Compliance
Complex regulatory compliance represents a significant challenge that can impede the growth of the global hazardous area equipment market. Hazardous area equipment is specifically designed to operate safely in environments where potentially explosive atmospheres or hazardous materials are present, and adherence to a complex web of safety regulations and standards is a fundamental requirement. However, the intricacies and variations in these regulations can create substantial hurdles for manufacturers, end-users, and the market as a whole. Here's how complex regulatory compliance can hamper the hazardous area equipment marketVarying Regional StandardsDifferent regions and countries often have their own set of safety standards and regulations, making it challenging for manufacturers to produce standardized hazardous area equipment that can be used globally. This variability necessitates costly customization and adaptation to meet regional compliance requirements.
Frequent Updates and RevisionsRegulatory bodies frequently update and revise safety standards to keep pace with evolving technologies and understandings of safety risks. Manufacturers and users must continually invest in staying current with these changes and ensuring their equipment remains compliant. Testing and Certification CostsTo prove compliance, manufacturers must undergo rigorous testing and certification processes. These processes can be expensive and time-consuming, and the associated costs may be passed on to end-users.
Inconsistent InterpretationThe interpretation and enforcement of safety regulations can vary even within a single region. This inconsistency can create uncertainty and challenges for both manufacturers and end-users seeking to meet compliance requirements. Resource-Intensive Compliance ManagementManaging compliance across an organization can be resource-intensive, requiring dedicated personnel and specialized knowledge. Small and medium-sized enterprises (SMEs) may face difficulties in managing these resources, potentially hampering their ability to invest in hazardous area equipment.
Compliance Documentation and Record-KeepingRobust documentation and record-keeping are necessary for compliance. Maintaining accurate records and documentation can be labor-intensive and may result in additional administrative burdens and costs. Innovation and Technological AdvancementsAs technology advances, the regulatory landscape must evolve to address new challenges and risks. This constant adaptation can make it difficult for manufacturers to keep up and for end-users to understand which equipment meets the latest safety standards.
Evolving Industry PracticesThe hazardous area equipment market must adapt to changes in industry practices, such as the integration of Industry 4.0 technologies. Ensuring that new technologies comply with existing regulations and standards can be a complex and time-consuming process. Global OperationsCompanies with global operations must navigate the complexities of different safety standards in various regions. This can lead to inefficiencies and increased costs, as equipment may need to be sourced and maintained differently in each location.
High Initial Costs
High initial costs represent a significant impediment to the growth of the global hazardous area equipment market. Hazardous area equipment is designed to operate safely in environments where potentially explosive atmospheres or hazardous materials are present, making it a crucial component for industries prioritizing worker safety and asset protection. However, the substantial upfront investment required for such specialized equipment can discourage companies from making these necessary safety upgrades. Here are some of the ways in which high initial costs can hamper the hazardous area equipment marketBudget ConstraintsFor many organizations, the high initial costs of hazardous area equipment can strain their budgets. Industries, especially those facing economic challenges or market uncertainties, may find it difficult to allocate the necessary funds for these safety measures.
Competing PrioritiesCompanies often face multiple operational and safety priorities that require financial resources. Choosing to invest in hazardous area equipment may mean diverting funds from other critical areas, such as research and development, expansion, or process optimization. Return on Investment (ROI) ConcernsThe ROI for hazardous area equipment is primarily measured in terms of safety and accident prevention. While difficult to quantify, safety improvements can save lives, reduce property damage, and limit operational disruptions. However, some organizations may struggle to justify the upfront costs without clear, immediate financial returns. Cost of ComplianceAdhering to safety regulations and standards can be costly. Meeting these requirements often entails investing in specialized hazardous area equipment to ensure compliance, further adding to the initial expense.
Complexity and CustomizationHazardous area equipment is typically complex and often requires customization to fit specific industry or site requirements. This customization can drive up costs, as each piece of equipment may need to be tailored to the unique needs of the environment. Market CompetitionIn competitive industries, companies may be reluctant to invest heavily in safety measures that increase production costs and potentially affect their market competitiveness, especially if their competitors are cutting costs in this area.
Cost of CertificationObtaining certification for hazardous area equipment can be an expensive and time-consuming process. Manufacturers must rigorously test and document their equipment to meet safety standards, and these costs are often passed on to the end-users. Limited Access to FinancingAccess to affordable financing options for hazardous area equipment may be limited, particularly for smaller businesses or companies operating in regions with underdeveloped financial markets. This can pose challenges for those looking to invest in safety equipment.
Maintenance and Lifecycle Cost
Maintenance and lifecycle costs are significant challenges that can hamper the growth of the global hazardous area equipment market. While this specialized equipment is essential for ensuring safety in potentially explosive or hazardous environments, the ongoing costs associated with maintenance and equipment lifespan can be a substantial burden on organizations. Here's how maintenance and lifecycle costs can impact the marketOngoing ExpensesHazardous area equipment requires regular inspections, maintenance, and testing to ensure it remains in compliance with safety standards. These ongoing expenses include not only the cost of inspections and maintenance but also the potential need for replacement parts or entire systems.
Skilled WorkforceEnsuring that hazardous area equipment is properly maintained often requires a skilled workforce with specialized training and certifications. Hiring and retaining such personnel can be costly, as they need to be knowledgeable about the equipment's intricacies and safety protocols. Downtime and Production LossesPerforming maintenance and repairs on hazardous area equipment often leads to downtime, which can be costly for industries that rely on continuous operations. The need to shut down processes for equipment servicing can result in production losses and reduced efficiency.
Aging InfrastructureOver time, hazardous area equipment can become outdated, leading to the need for costly upgrades or replacements to meet evolving safety standards and technological advancements. This can place a financial strain on organizations, especially if they have a large inventory of aging equipment. Complexity of EquipmentHazardous area equipment is inherently more complex than standard equipment, with features designed to withstand harsh conditions and ensure safety. The complexity can result in higher maintenance costs and the need for specialized technicians. Cost of Replacement PartsObtaining specialized replacement parts for hazardous area equipment can be expensive and sometimes challenging. Organizations may need to stock critical spare parts or rely on suppliers with lengthy lead times, impacting their ability to quickly address maintenance needs. Regulatory ComplianceCompliance with evolving safety regulations is essential, and this often involves upgrades and changes to equipment to maintain compliance. Staying abreast of regulatory changes and adapting equipment accordingly can be both costly and time-consuming.
Economic FactorsEconomic downturns or financial constraints can limit an organization's ability to invest in proper maintenance and the replacement of aging hazardous area equipment. This can compromise safety and increase the risk of accidents. To address the challenge of maintenance and lifecycle costs, organizations may need to adopt a proactive approach. This includes effective asset management, predictive maintenance strategies, and embracing technological advancements such as condition monitoring and asset performance management. Additionally, governments and regulatory bodies can play a role by providing incentives or support for organizations to maintain and upgrade their hazardous area equipment to ensure long-term safety and compliance. While the maintenance and lifecycle costs are indeed a challenge, they are crucial investments to safeguard personnel and assets in hazardous environments, and finding cost-effective and efficient strategies to manage them is imperative for the growth of the hazardous area equipment market.
Ask for Discount Request Customization
Key Market Trends
Explosion-Proof Equipment
Explosion-proof equipment is a major trend in the global hazardous area equipment market, playing a significant role in ensuring the safety of personnel and assets in environments where explosive gases or dust are present. This specialized equipment is designed to prevent ignition sources from causing potentially catastrophic explosions. Several factors contribute to the driving force of explosion-proof equipment in the hazardous area equipment marketSafety ComplianceRegulatory authorities and industry standards require organizations to adhere to stringent safety regulations in hazardous environments. Explosion-proof equipment is essential for achieving compliance and safeguarding personnel and property. This regulatory pressure drives the demand for such equipment.
Preventing Catastrophic EventsIn industries like oil and gas, petrochemicals, and mining, the consequences of an explosion can be devastating. Explosion-proof equipment is designed to contain and prevent the ignition of explosive substances, reducing the risk of catastrophic events, including fires and explosions. Increased Industrial ActivityThe global increase in industrial activity, including oil refineries, chemical processing, and manufacturing, drives the need for explosion-proof equipment. As these industries expand, so does the demand for safety measures that include explosion-proof electrical components, enclosures, and systems.
Technological AdvancementsOngoing technological advancements have led to the development of more sophisticated and efficient explosion-proof equipment. Innovations in materials, design, and manufacturing processes result in safer and more reliable solutions. Global Energy Exploration and ProductionThe energy sector, particularly oil and gas, is a significant driver for explosion-proof equipment. Exploration and production activities often take place in hazardous environments. The use of this equipment ensures safety and the uninterrupted operation of energy infrastructure. Chemical Processing and Petrochemical IndustriesIndustries dealing with hazardous chemicals and substances rely heavily on explosion-proof equipment. The chemical and petrochemical sectors demand reliable safety measures to protect against explosions and fires, making this equipment indispensable.
Mining and Heavy IndustryMining operations extract valuable resources from potentially explosive environments. Explosion-proof equipment is critical for managing the risks associated with dust, gas, and other hazardous elements in mining facilities. Advanced Materials and DesignAdvancements in materials, such as explosion-proof enclosures made from durable materials like stainless steel or aluminum, and innovative designs, have made equipment more rugged, durable, and capable of withstanding extreme conditions. Automation and Industry 4.0The integration of automation and Industry 4.0 practices in industries necessitates explosion-proof equipment that can operate within advanced technological environments. Smart sensors and interconnected systems enhance safety in hazardous areas.
GlobalizationCompanies operating internationally require standardized equipment that can be used across various regions. Explosion-proof equipment that meets global safety standards becomes a necessity for such organizations. In summary, explosion-proof equipment is a key driver in the global hazardous area equipment market. Its critical role in preventing accidents, protecting lives and assets, and ensuring compliance with stringent safety regulations positions it as an essential component of modern industrial safety in hazardous environments. As industrial activities continue to expand and become more technologically advanced, the demand for explosion-proof equipment is expected to grow, making it a vital segment within the hazardous area equipment market.
Rapid Technological Advancements
Rapid technological advancements are serving as a powerful driver for the global hazardous area equipment market. This market encompasses a range of specialized equipment designed to operate safely in potentially explosive or hazardous environments, such as those found in the oil and gas, chemical, mining, and manufacturing industries. Several key factors highlight how technological advancements are propelling this market forwardEnhanced SafetyTechnological innovations in hazardous area equipment have led to more reliable and effective safety measures. Advanced sensors, communication systems, and monitoring technologies improve safety by providing real-time data, immediate alerts, and automated responses to potential risks.
IoT IntegrationThe Internet of Things (IoT) is revolutionizing hazardous area equipment. IoT-enabled sensors and devices offer remote monitoring and data collection capabilities, allowing for proactive maintenance and predictive analytics to prevent equipment failures and accidents. AutomationThe integration of automation in hazardous environments reduces the need for human intervention in high-risk areas. Automated systems can perform tasks with precision, minimizing the risk to personnel and assets.
Smart SensorsSmart sensors play a pivotal role in safety by detecting changes in environmental conditions, such as the presence of flammable gases or the build-up of dust. They transmit data in real-time, enabling swift responses to safety threats. Data-Driven Decision-MakingTechnological advancements in data analytics and artificial intelligence enable data-driven decision-making in hazardous environments. This empowers organizations to optimize safety measures and respond rapidly to changing conditions. Advanced MaterialsThe development of advanced materials enhances the durability and ruggedness of hazardous area equipment, making it more resilient in harsh environments. These materials extend equipment lifespans and reduce maintenance needs.
Predictive MaintenanceTechnological innovations facilitate predictive maintenance, which helps organizations identify equipment issues before they lead to failures. This minimizes downtime, reduces costs, and keeps operations safe and efficient. Integration with Industry 4.0Hazardous area equipment is increasingly integrated with Industry 4.0 principles, facilitating digital transformation in industries. This integration allows for real-time data exchange, process optimization, and improved safety protocols. Environmental SustainabilityTechnology-driven solutions are aligning with the growing emphasis on environmental sustainability. Hazardous area equipment is being developed to not only enhance safety but also reduce environmental impact and emissions.
Global StandardizationTechnology is contributing to the global standardization of hazardous area equipment, making it easier for multinational companies to maintain consistent safety measures across their global operations. In conclusion, rapid technological advancements are revolutionizing the hazardous area equipment market by enhancing safety measures, improving operational efficiency, and aligning with evolving industry needs and environmental concerns. These advancements ensure that industries can operate more safely and efficiently in potentially explosive or hazardous environments, making technological innovation a driving force in the continued growth of this essential market.
Segmental Insights
End User Industry Insights
Oil & Gas held the largest share of Hazardous Area Equipment Market in 2023.
Several factors contributed to the oil and gas sector's leading position in this market. Firstly, the inherent risks associated with oil and gas operations, including flammable gases and volatile hydrocarbons, necessitate stringent safety protocols and reliable equipment to prevent accidents. This sector’s high safety standards and regulatory requirements have propelled the adoption of sophisticated hazardous area equipment. Furthermore, the trend towards deeper offshore drilling and unconventional extraction methods, such as hydraulic fracturing, has amplified the need for advanced safety solutions capable of withstanding extreme conditions.
The oil and gas industry's commitment to enhancing operational safety and efficiency has also played a crucial role in the market's growth. Companies are increasingly investing in cutting-edge technology to monitor and mitigate risks in real-time, ensuring the safety of their workforce and minimizing the environmental impact of their operations. This proactive approach not only helps in compliance with regulatory frameworks but also fosters a culture of safety and sustainability within the industry, further boosting the demand for hazardous area equipment.
Additionally, the market dynamics are influenced by the ongoing digital transformation within the oil and gas sector. The integration of IoT (Internet of Things) and AI (Artificial Intelligence) technologies into hazardous area equipment has revolutionized the way safety and operational data are collected, analyzed, and acted upon. This technological evolution has led to the development of smarter, more responsive equipment that enhances the overall safety and efficiency of oil and gas operations. As a result, the sector’s continuous pursuit of innovation and excellence solidifies its leading share in the hazardous area equipment market.
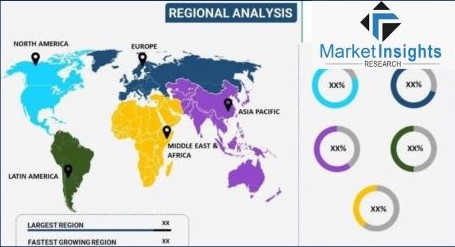
Regional Insights
In 2023, the Asia Pacific region emerged as the dominant force in the hazardous area equipment market, reflecting its rapid industrialization and urbanization. The region's robust economic growth, coupled with significant investments in infrastructure, has fueled demand for advanced safety equipment designed for hazardous environments. Countries like China, India, and Japan, with their expanding oil and gas, chemical, and mining industries, have become major consumers of hazardous area equipment, driving the market's expansion.
Several factors contribute to Asia Pacific's leading position in this market. The region's fast-paced industrial activities, particularly in heavy industries such as petrochemicals, pharmaceuticals, and manufacturing, require stringent safety measures to mitigate risks associated with explosive and flammable materials. The increasing number of industrial projects, along with a growing awareness of workplace safety and stringent regulatory standards, has accelerated the adoption of hazardous area equipment across various sectors.
Moreover, the region's energy demands are rising rapidly, prompting significant investments in oil and gas exploration and production. These activities often occur in hazardous environments, necessitating the use of specialized equipment to ensure operational safety and efficiency. The emphasis on enhancing energy security and reducing environmental impact has further driven the demand for high-quality, reliable hazardous area equipment in the Asia Pacific region.
In addition to industrial growth, the Asia Pacific region is also experiencing a technological transformation. The integration of advanced technologies such as IoT, AI, and automation into hazardous area equipment has revolutionized safety protocols and operational management. This technological advancement has led to the development of smarter, more efficient safety solutions, contributing to the region's dominance in the market. As industries continue to evolve and prioritize safety, the Asia Pacific region is likely to maintain its leading position in the hazardous area equipment market.
Recent Developments
- In October 2023, Hazchem Safety, a prominent provider of safety solutions and personal protective equipment (PPE), unveiled its innovative ORKA ECO range coverall. This industry-leading development not only enhances safety standards but also underscores the company's strong commitment to environmental sustainability. Each ORKA ECO coverall achieves a carbon footprint reduction of 3.7 kg CO2e, reflecting a substantial advancement in eco-friendly protective gear.
Key Market Players
- ABB Ltd.
- EatonCorporation plc
- SiemensAG
- RockwellAutomation Inc.
- PhoenixMecano
- R. StahlAG
- CZElectric Co. Ltd
- MarechalElectric Group
|
By Equipment |
By End User Industry |
By Region |
|
|
|
|
|
Related Reports
FAQ'S
For a single, multi and corporate client license, the report will be available in PDF format. Sample report would be given you in excel format. For more questions please contact:
Within 24 to 48 hrs.
You can contact Sales team (sales@marketinsightsresearch.com) and they will direct you on email
You can order a report by selecting payment methods, which is bank wire or online payment through any Debit/Credit card, Razor pay or PayPal.
Discounts are available.
Hard Copy