Semaglutide Market Size, Share & Trends Analysis Report By Product (Ozempic, Wegovy, Rybelsus), By Application (Type 2 Diabetes Mellitus, Obesity), By Route Of Administration, By Distribution Channel, By Region, And Segment Forecasts, 2025 - 2035
Published Date: April - 2025 | Publisher: MRA | No of Pages: 240 | Industry: healthcare | Format: Report available in PDF / Excel Format
View Details Buy Now 2999 Download Sample Ask for Discount Request CustomizationSemaglutide Market Size & Trends
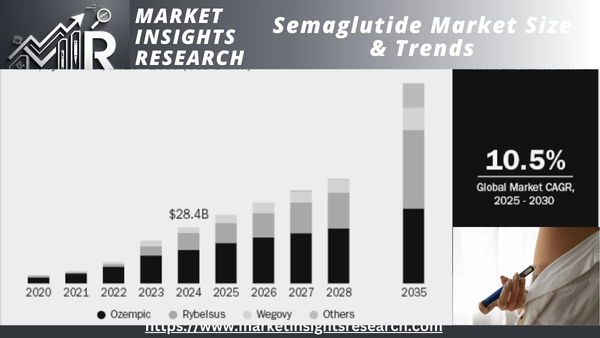
The market size for semaglutide globally was estimated at USD 28.43 billion in 2024 and is expected to grow at a CAGR of 10.47% during the period 2025-2035. The global industry for semaglutide is propelled by the expanding trend for type 2 diabetes and obesity, increasing demand for GLP-1 receptor agonists, and increasing use of weight management therapy. Growing clinical uses, regulatory clearances, and robust sales performance continue to fuel market growth. Large players invest in R&D, and positive reimbursement policies and patient preference for once-weekly dosing drive market growth. Pharmaceutical partnerships and geographic expansion strategies also drive market dynamics.
Download Sample Ask for Discount Request Customization
The increasing global obesity rate is one of the major drivers for the growth of the semaglutide market, especially for Wegovy. WHO statistics (March 2024) indicate 890 million obese adults, with related healthcare costs estimated to be over USD 18 trillion by 2060. Obesity-related diseases, such as type 2 diabetes and cardiovascular diseases, are generating increased demand for effective pharmacological treatments. Wegovy, a GLP-1 receptor agonist, treats obesity by modulating appetite and caloric consumption. Regulatory approval and clinical data drive further adoption. As obesity continues to weigh heavily on healthcare systems and economies, the marketplace is increasing, making Wegovy a top solution in physician-recommended medical weight loss.
The growing burden of diabetes is a primary driver for the industry around semaglutide, specifically for Ozempic and Rybelsus. The IDF Diabetes Atlas (2021) estimates 537 million adults aged 20-79 years with diabetes, expected to increase to 643 million by 2030 and 783 million by 2045. More than 90% have type 2 diabetes, fueled by urbanization, aging, and obesity. Almost 240 million are undiagnosed, putting pressure on efficient treatments. Semaglutide-based treatments, such as Ozempic (injectable) and Rybelsus (oral), enhance glycemic control and cardiovascular risk, making them key solutions during the increasing diabetes pandemic and rising healthcare costs.
Novo Nordisk has made significant progress in increasing its diabetes and obesity care product reach, with a 6% increase in the number of patients treated with diabetes products to 43 million in 2024. The increase in obesity treatments was especially significant, with the number of patients increasing to 2.2 million in 2024, a 100% increase due to the widened launch of Wegovy in more countries. But the number of vulnerable patients reached with Diabetes care products reduced by 5%, mainly on account of access reduction through affordability efforts. The Changing Diabetes in Children program also demonstrated robust progress, to 64,743 children as of the end of 2024, towards a goal of 100,000 by 2030.
The willingness to pay for semaglutide impacts market growth, pricing strategy, and uptake. Patients, prescribers, and payers acknowledge its clinical benefits in weight management, type 2 diabetes, and reduction of cardiovascular risk, which justifies its pricing. In spite of the cost of treatment, patients willing to pay out-of-pocket for long-term health effects opt for the drug, especially in markets where reimbursement is scarce.
Healthcare payers and insurers determine the cost-effectiveness of semaglutide in lowering obesity-related complications, impacting healthcare costs. This evaluation results in reimbursement approvals and access programs, promoting adoption. Semaglutide's cost-benefit profile, compared to available therapies, maintains demand and revenue growth.
Semaglutide Clinical Trials - Pipeline Analysis
The development pipeline for semaglutide-based treatments identifies a wide range of indications outside of diabetes and obesity, therapeutic areas for which approved pharmaceuticals such as Ozempic and Wegovy currently reign supreme. Some of the major ongoing trials are aimed at disorders including Alzheimer's disease, non-alcoholic steatohepatitis (NASH), cardiovascular disease, and chronic kidney disease, tapping into unserved needs within these therapeutic areas. Although diabetes and obesity continue to be the core focus, with many studies in advanced stages (Phase 3 and 4), the investigation into semaglutide for such conditions as early Alzheimer's disease and liver conditions creates opportunities for market growth. The emphasis on new combinations and specialized therapies in these other indications could substantially raise the clinical value of semaglutide and broaden its therapeutic reach, in turn driving treatment area growth in emerging market
Growth Scenarios for the Global Semaglutide Market (2035) - Opportunity Analysis
In order to present a thorough understanding of the future growth prospects of the semaglutide market, we have undertaken a thorough market size analysis taking into account several growth scenarios. This analysis seeks to provide strategic insights into how different factors-regulatory advancements, adoption rates, reimbursement policies, and market penetration into new therapeutic indications-may impact the course of the market over the period of the next decade.
Market size forecasts for the global semaglutide market are varied depending on various growth scenarios, each considering regulatory advancements, adoption rates, reimbursement practices, and market growth across new indications. These forecasts offer a strategic perspective on possible market trends and the factors that affect overall growth.
The pessimistic market size is the lower-end estimate, considering regulatory barriers, slower adoption rates, and market saturation. In this case, the market is expected to grow to around USD 58.6 billion by 2035. Pricing pressures, supply limitations, competition from other therapies, and limiting reimbursement policies may be the reasons for slower market growth.
The base case market size is the most likely scenario, factoring in prevailing market trends, demand forecasts, and ongoing commercial investments. The market is projected to grow to around USD 93.60 billion by 2035, fueled by growing therapeutic uses, rising patient adoption, and ongoing research and development investment. This scenario presumes stable regulatory backing and consistent market growth.
The optimistic size of the market is the upper estimate based on surging adoption, positive reimbursement practices, and extending into novel indications beyond diabetes treatment. Based on this projection, the market for semaglutide may increase to around USD 116.5 billion in 2035. Wider global availability, increased indications in obesity and cardiovascular complications, and additional clinical developments would be responsible for this degree of growth.
Regulatory environments, supply chain dynamics, innovation, and accessibility strategies will determine the semaglutide industry path. On-going investment in research, pricing strategies, and market growth activities will decide the ultimate market size and impact the long-term commercial viability of semaglutide-based treatments.
Off-Label Use and Counterfeit SemaglutideRegulatory and Market Implications
The off-label use of unapproved and compounded semaglutide has been a concern for the FDA, with potential risks like dosing mistakes, safety issues, and more than 455 reports of adverse events as of February 2025. Increased demand for GLP-1 receptor agonists for weight control has fueled an entry of illegally promoted and counterfeit products, including fake Ozempic. The FDA cautions that compounded semaglutide, particularly in salt formulations, has no regulation, creating doubts regarding efficacy and safety.
Regulatory initiatives against compounded and counterfeit semaglutide may upset supply chains, affect prescribing patterns, and tighten oversight of off-label use. More patients using semaglutide to lose weight-even though it originally gained FDA approvals for diabetes-could affect market supply and healthcare provider choices. The recent FDA probe into counterfeit Ozempic is part of a larger initiative to suppress unauthorized copies of the drug.
Through December 2023, the FDA has made thousands of units of counterfeit Ozempic seizures and warned against using products with lot number NAR0074 and serial number 430834149057. These fakes use untested ingredients and non-sterile needles, which elevate the chance of infection. Five adverse reactions have been reported, but none were severe. The FDA recommends that pharmacies obtain only from licensed distributors and encourages patients to check their prescriptions.
With the semaglutide shortage no longer an issue, the FDA has issued clarification regarding compounding policies. State-licensed pharmacies and doctors (503A facilities) can compound semaglutide through February 21, 2025, before April 22, 2025, while outsourcing facilities (503B) can continue through May 22, 2025, or until a court decision is made in Outsourcing Facilities Association (OFA) v. FDA. The FDA can still take enforcement action against subpar or unsafe compounded products. These regulatory changes and lingering legal fights may redefine compounding policy and market competition in the GLP-1 receptor agonist category, influencing both the treatment of diabetes and weight-loss therapy.
Patent Expiration Projections and Market Consequences
Loss of patent for Ozempic, Rybelsus, and Wegovy, all part of the semaglutide market, is highly significant in terms of both opportunity and challenge. With patents expiring between 2026 and 2032, generic competition will swell, with the potential to cut market share and prices. But this creates doors for biosimilars and alternatives, in turn, likely to increase patient access and promote market growth. Firms are going to need to emphasize differentiation, innovation, and expanded indications to stay ahead. Moreover, patent expirations can potentially divert attention towards next-generation therapy, further transforming the market space.
Pricing Dynamics and Affordability Impact for Semaglutide-Based Treatments
The cost of semaglutide-based treatments, including Ozempic, Wegovy, and Rybelsus, is a significant factor influencing their market dynamics. These medications are positioned within a specialized segment targeting diabetes and obesity, where accessibility and affordability are key to broad adoption. The impact of insurance coverage, discounts, and patient assistance programs on out-of-pocket costs is substantial, allowing for greater patient access and adherence. For patients without insurance or with limited coverage, the availability of savings programs can significantly reduce financial barriers, ensuring continued demand. Moreover, as competition grows in the weight management and diabetes treatment sectors, pricing strategies and cost transparency will be critical in maintaining market share. The ongoing adjustments to pricing structures and cost-saving measures directly influence both patient outcomes and long-term market growth, as the affordability of such treatments remains central to addressing the increasing global burden of these chronic conditions.
Market Concentration & Characteristics
The market is evolving with advances in drug formulations, delivery systems, and combination therapies. Extended-release products, oral formulations, and new co-therapies are enhancing patient compliance and therapeutic efficacy. Advances are aimed at maximizing bioavailability, minimizing gastrointestinal side effects, and broadening indications from diabetes and obesity to cardiovascular and neurodegenerative diseases.
The market is characterized by high entry barriers in the form of stringent regulatory standards, high R&D costs, and Novo Nordisk's robust intellectual property protections. The technical complexity of peptide-based drug development, sophisticated manufacturing processes, and the requirement for large-scale clinical trials further limit potential entrants. Moreover, Novo Nordisk's established market presence and dominance over global supply chains further support its stronghold.
Regulatory bodies such as the FDA and EMA have strict standards for semaglutide products, including exhaustive clinical trials to prove long-term safety and efficacy. Market access is largely driven by pricing and reimbursement policy since expensive treatment leads to demand for good insurance coverage. Regulatory alignment between regions supports global adoption, especially in developing markets.
Semaglutide faces competition from other GLP-1 receptor agonists, DPP-4 inhibitors, SGLT2 inhibitors, and insulin. Lifestyle changes, bariatric surgery, and other non-pharmacological measures are also alternatives. Semaglutide's effectiveness in weight control, cardiovascular outcomes, and patients' preference for less frequent dosing drive its market growth.
Novo Nordisk is building out its semaglutide franchise in high-growth regions like Asia-Pacific, Latin America, and the Middle East, fueled by increasing prevalence of diabetes and obesity and the development of healthcare infrastructure. The company aims to achieve regulatory approval, refine price strategies, and improve reimbursement systems to increase patient access. Market penetration is supported by strategic relationships with healthcare providers and government-sponsored programs, while manufacturing and distribution networks within local regions mitigate supply chain issues.

Download Sample Ask for Discount Request Customization
Product Insights
Ozempic segment led the way with a revenue share of 59.62% in 2024, fueled by robust clinical efficacy, extensive regulatory approvals, and growing adoption in type 2 diabetes. Novo Nordisk's wide distribution network, supportive reimbursement policies, and continued clinical trials supported its dominance. Once-weekly dosing of the drug, cardiovascular advantages, and growing indications fueled growth. Healthy sales in Europe and North America, along with Asia-Pacific and Latin American market growth, cemented its position. Further R&D, supply chain maximization, and value pricing supported Ozempic's dominance under demand pressures. A Diabetes Care study, "Economic Costs of Diabetes in the U.S. in 2022," examined diabetes's economic impact on the U.S. economy.
The economic burden of diagnosed diabetes in 2022 was USD 412.9 billion, consisting of USD 306.6 billion in direct medical costs and USD 106.3 billion in indirect costs. The report shows an increasing economic burden with hospital inpatient care, prescription drugs, and diabetes supplies being key drivers. Indirect costs comprise loss of productivity, absenteeism, and disability. The research emphasizes the imperative of effective prevention and management measures to stem mounting costs. Wegovy is expected to expand at a noteworthy CAGR during the forecast period due to the surge in demand for GLP-1 receptor agonists for weight management.
Growing obesity rates, increased insurance coverage, and robust clinical success favor market growth. Novo Nordisk's scale-up of production and regulatory clearances across different geographies further add to the growth opportunities. Eli Lilly's Zepbound competition and regulator pressure on off-label use of semaglutide will impact the market. With continuous consumer demand and physician uptake, though, Wegovy will continue to have robust impetus, solidifying its position in the weight-loss treatment market. Sales growth in the future will be subject to supply stability and pricing tactics.
Application Insights
The type 2 diabetes mellitus segment dominated the market and held a revenue share of 71.90% in 2024 due to its increasing worldwide prevalence and rising demand for sophisticated treatments.
Increasing usage of GLP-1 receptor agonists, such as semaglutide (Ozempic, Wegovy), has had a tremendous impact on treatment patterns. Increasing healthcare access, supportive reimbursement policies, and ongoing innovation in insulin products are additional drivers for growth in the market. Though treatments for Type 1 Diabetes continue to be the requirement, Type 2 Diabetes dominates diagnosed cases, further solidifying its market dominance. Investment by pharma companies and regulatory approvals will dictate competitive forces and treatment availability in 2024. The obesity area shall experience the highest CAGR over the forecast horizon due to growing demand for GLP-1 receptor agonists such as Wegovy for obesity control.
Increasing prevalence of obesity, increasing insurance coverage, and increasing physician acceptance of pharmacological treatment drive market growth. Regulatory clearances and clinical evidence for semaglutide's effectiveness in weight loss further drive adoption. With growing consumer awareness and relief in supply constraints, the obesity segment will grow faster than other indications, making semaglutide a leading driver in the changing weight management market.
Route of Administration Insights
Parenteral administration was the leading mode of administration and had a revenue share of 88.46% in 2024, supported by the extensive use of Ozempic and Wegovy, which are given as injectables.
Their strong efficacy and well-established use among GLP-1 receptor agonists in diabetes and obesity treatment supported their market leadership. Though a non-injectable version of semaglutide is in the process of being developed for both Ozempic and Wegovy, injectable form still holds dominance position based on demonstrated patient compliance and effectiveness. Further development of delivery forms can dictate future market behavior, but parenteral is holding the greatest market share presently. Oral delivery method is anticipated to have the highest CAGR through the forecast period based on emerging non-injectable delivery solutions.
Novo Nordisk is progressing oral versions of Ozempic (semaglutide) and Wegovy (semaglutide) in the pipeline. These drugs are intended to enhance patient compliance and increase market accessibility. Though injectable forms continue to be the most preferred, growing preference for easy oral forms and development in drug delivery technology will be expected to spur market adoption, making oral semaglutide a major growth driver in the next few years.
Distribution Channel Insights
The retail pharmacies segment dominated the market and held a revenue share of 55.09% in 2024, thanks to rising demand from consumers for GLP-1 receptor agonists such as Ozempic and Wegovy.
Availability of the drugs through retail chains improved patient convenience, leading to increased sales volumes. Increased insurance coverage and direct-patient purchases also contributed to dominance within this segment. Although hospital and internet pharmacies are also important in their own ways, retail pharmacies were aided by extensive distribution networks and patient interactions led by pharmacists, establishing them as the main distribution channel for semaglutide-based treatments. Semaglutide Market Share by Distribution Channel, 2024 (%)
Growing demand for Ozempic and Wegovy, combined with home delivery convenience, is driving this growth. Improved telemedicine services and direct-to-consumer sales models have also driven adoption. Online prescription fulfillment regulatory approvals and growing insurance coverage help in market penetration. Even as retail pharmacies are still the leaders, online platforms are favored by convenience of access, competitive pricing, and anonymous buying, making them the fastest-growing distribution channel for semaglutide therapies.
Regional Insights
The North America semaglutide market is a leader in 2024 with 74.35% of the world's share due to high rates of obesity and diabetes, robust health care infrastructure, and widespread use of GLP-1 receptor agonists such as Ozempic and Wegovy.
The region is supported by favorable reimbursement policies, growing awareness of weight management, and a rise in off-label prescriptions. The U.S. leads owing to strong pharma regulations, high patient involvement, and large investments in obesity drugs. Furthermore, market growth is driven by constant clinical development, such as oral semaglutide products. With constant regulatory monitoring and increasing treatment accessibility, North America is the biggest market for semaglutide-based treatments. Semaglutide Market Trends, by Region, 2025 - 2035
U.S. Semaglutide Market Trends
The United States leads the North America semaglutide market, powered by rising demand for GLP-1 receptor agonists in the management of diabetes and obesity. Early approvals, and widespread R&D efforts support market growth. The increasing use of semaglutide for weight management, despite initial approval for diabetes, is revolutionizing prescribing behavior. Retail pharmacy is the leading mode of distribution, followed by growth in online pharmacies due to convenience, and direct-to-consumer channels.
Europe Semaglutide Market Trends
Europe shows robust semaglutide industry development, with leading contributions from Germany, France, and the UK. The area enjoys robust clinical research infrastructure, government support in terms of obesity and diabetes control initiatives, as well as higher GLP-1 receptor agonist prescriptions. Government policies promoting obesity therapeutics further propel take-up.
The growth of the UK semaglutide market is driven by rising expenditure on diabetes and obesity medicines, as well as the need for personalized medicine. Increasing weight management programs and clinical trials assessing new formulations drive market growth. Retail pharmacy is an important driver of semaglutide access, augmenting conventional hospital pharmacy channels.
Semaglutide market in Germany will grow in the forecast period. Germany is at the top of the Europe market because of its highly developed biopharmaceutical manufacturing and strong healthcare system. Growth is driven by growing use of GLP-1 receptor agonists to treat metabolic disorders and obesity. Hospital pharmacies dominate the market landscape, but online expansion of pharmacies enhances patients' access to semaglutide-based treatments.
France semaglutide market is supported with robust regulatory support and public health programs focused on diabetes and obesity control. Growing awareness and reimbursement policies for GLP-1 receptor agonists drive higher adoption levels. Hospital pharmacies continue to be the key distribution channel, and retail and online pharmacies increasingly find a presence.
Asia Pacific Semaglutide Market Trends
The Asia Pacific semaglutide market is experiencing fast growth due to rising incidence of obesity and diabetes, healthcare investments, and regulatory clearance of GLP-1 therapies. China, Japan, and India dominate the market, bolstered by indigenous pharma production and rising patient awareness. The market in the region is witnessing rising adoption of semaglutide in both hospital and retail pharmacy channels.
Japan's market for semaglutide is growing based on government-sponsored campaigns for managing diabetes and obesity. Demand is fuelled by an aging population as well as by the growing trend of obesity. Retail pharmacies dominate semaglutide distribution with hospital pharmacies extending disease management activities.
Semaglutide market in China is expanding quickly, driven by government policies to modernize healthcare and expand local biopharmas. Rising demand for treatment of diabetes and obesity, as well as growing online pharmacies, is changing the accessibility of markets. The nation is witnessing strong investments in research and manufacturing of GLP-1 receptor agonists.
Latin America Semaglutide Market Trends
Latin America is witnessing modest growth in the semaglutide market, with Brazil and Argentina taking the lead. Growth in healthcare spending and growing obesity treatment awareness are fueling penetration in the market. Government diabetes management programs are expanding to favor semaglutide uptake in the region.
Brazil semaglutide market is expanding with the high prevalence of obesity and the growing efforts of the government to increase healthcare access. Local biopharmaceutical production investments and collaborations with foreign companies help augment semaglutide access. Retail pharmacies are helping to increase the access to GLP-1 treatments.
Middle East & Africa Semaglutide Market Trends
Middle East and Africa is witnessing increasing demand for semaglutide, especially in Saudi Arabia and the UAE. Government healthcare programs and rising obesity rates are major drivers. The market is growing as healthcare infrastructure is improving and semaglutide availability is growing through hospital and retail pharmacies.
Saudi Arabia's semaglutide market is expanding due to healthcare reforms and increasing obesity-related comorbidities. Government investment in biotechnology and chronic disease management underpin adoption of semaglutide. Hospital and retail pharmacies are major distribution channels, with increasing online penetration of pharmacies allowing better patient access.
Major Semaglutide Company Insights
Novo Nordisk leads in the semaglutide market with a dominant position through sole development, production, and commercialization of Ozempic, Wegovy, and Rybelsus.
The firm's solid market position is backed by ongoing product innovation, global regulatory clearances, and increasing production capacity to address growing demand. Novo Nordisk's strategic investments in supply chain growth and continuous research in oral semaglutide formulations further consolidate its leadership. With no direct competitors for branded semaglutide, the firm has control over market dynamics, pricing strategies, and distribution channels, which will continue to drive growth in the GLP-1 receptor agonist segment. However, as the drug approaches patent expiration, the market landscape is expected to shift, with biosimilar competition and alternative GLP-1 receptor agonists or combination therapies challenging its dominance Competitive Landscape & Emerging Players
Lexicon PharmaceuticalsLexicon licensed LX9851 to Novo Nordisk for obesity treatment, exploring combination with semaglutide, with up to USD 1 billion in payments.
Viking TherapeuticsViking Therapeutics' VK2735, a dual GLP-1/GIP receptor agonist, demonstrated compelling weight loss activity in Phase 1/2 studies, competing with semaglutide.
Eli Lilly and CompanyLilly's Zepbound beat Wegovy on weight loss (20.2% vs. 13.7%) in SURMOUNT-5 trial, proving higher efficacy in managing obesity without diabetes.
Upcoming BiosimilarsAs the patent on semaglutide approaches expiry, biosimilar producers, such as large generic and biotech companies, are lining up to enter the fray. Companies are investigating biosimilar alternatives, which could transform the market dynamics beyond 2032.
Key Semaglutide Companies
The following are the leading companies in the semaglutide market. These companies collectively hold the largest market share and dictate industry trends.
- Novo Nordisk
- Eli Lilly
- Viking Therapeutics
- Lexicon Pharmaceuticals
- Biocon
- AstraZeneca
Recent Developments
-
In February 2025, Novo Nordisk announced the FDA has declared the Wegovy and Ozempic shortage over, confirming U.S. supply meets demand. The company invested USD 6.5 billion to expand production and launched the AI-powered Find My Meds app. Novo Nordisk warns against counterfeit drugs and emphasizes responsible use of its FDA-approved semaglutide medicines.
-
In January 2025, Novo Nordisk announced that semaglutide 7.2 mg achieved 20.7% weight loss in the STEP UP trial, surpassing semaglutide 2.4 mg and placebo. The trial confirmed safety and tolerability. Another phase 3 trial, STEP UP T2D, is ongoing. Results reinforce semaglutide’s role in obesity treatment alongside Wegovy’s cardiovascular benefits.
-
In June 2024, Novo Nordisk’s Phase 3 FLOW trial showed Ozempic (semaglutide) 1 mg reduced kidney disease-related events by 24% in type 2 diabetes patients with CKD. The FDA is reviewing a label extension, with a decision expected in January 2025. Results were published in NEJM and presented at ADA 2024.
Semaglutide Market Report Scope
|
Report Attribute |
Details |
|
Market size value in 2025 |
USD 34.57 billion |
|
Revenue forecast in 2035 |
USD 93.60 billion |
|
Growth rate |
CAGR of 10.47% from 2025 to 2035 |
|
Actual data |
2018 - 2024 |
|
Forecast period |
2025 - 2035 |
|
Quantitative units |
Revenue in USD million/billion and CAGR from 2025 to 2035 |
|
Report coverage |
Revenue forecast, company ranking, competitive landscape, growth factors, trends |
|
Segments covered |
Product, application, route of administration, distribution channel, and region |
|
Regional scope |
North America; Europe; Asia Pacific; Latin America; Middle East & Africa |
|
Country scope |
U.S., Canada, Mexico, UK, Germany, France, Italy, Spain, Denmark, Sweden, Norway, China, Japan, India, Australia, South Korea, Thailand, Brazil, Argentina, South Africa, Saudi Arabia, UAE, Kuwait |
|
Key companies profiled |
Novo Nordisk; Eli Lilly; Viking Therapeutics; Lexicon Pharmaceuticals; Biocon; AstraZeneca |
|
Customization scope |
Free report customization (equivalent up to 8 analysts working days) with purchase. Addition or alteration to country, regional & segment scope. |
|
Pricing and purchase options |
Avail customized purchase options to meet your exact research needs. Explore purchase options |
Download Sample Ask for Discount Request Customization
Global Semaglutide Market Report Segmentation
This report forecasts revenue growth at global, regional, and country levels and provides an analysis of the latest industry trends in each of the sub-segments from 2018 to 2035. For this study, Grand View Research has segmented the global semaglutide market report based on product, application, route of administration, distribution channel, and region
-
Product Outlook (Revenue, USD Million, 2018 - 2035)
-
Ozempic
-
Wegovy
-
Rybelsus
-
Others
-
-
Application Outlook (Revenue, USD Million, 2018 - 2035)
-
Type 2 Diabetes Mellitus
-
Obesity
-
Others
-
-
Route of Administration Outlook (Revenue, USD Million, 2018 - 2035)
-
Parenteral
-
Oral
-
-
Distribution Channel Outlook (Revenue, USD Million, 2018 - 2035)
-
Hospital Pharmacies
-
Retail Pharmacies
-
Online Pharmacies
-
-
Regional Outlook (Revenue, USD Million, 2018 - 2035)
-
North America
-
U.S.
-
Canada
-
Mexico
-
-
Europe
-
UK
-
Germany
-
France
-
Italy
-
Spain
-
Denmark
-
Sweden
-
Norway
-
-
Asia Pacific
-
Japan
-
China
-
India
-
Australia
-
South Korea
-
Thailand
-
-
Latin America
-
Brazil
-
Argentina
-
-
Middle East & Africa
-
South Africa
-
Saudi Arabia
-
UAE
-
Kuwait
-
-
Related Reports
FAQ'S
For a single, multi and corporate client license, the report will be available in PDF format. Sample report would be given you in excel format. For more questions please contact:
Within 24 to 48 hrs.
You can contact Sales team (sales@marketinsightsresearch.com) and they will direct you on email
You can order a report by selecting payment methods, which is bank wire or online payment through any Debit/Credit card, Razor pay or PayPal.
Discounts are available.
Hard Copy